Actions
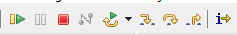
At the top of the toolbar, there are multiple buttons which are responsible for debugger actions. These buttons are only active when a debug configuration is started.
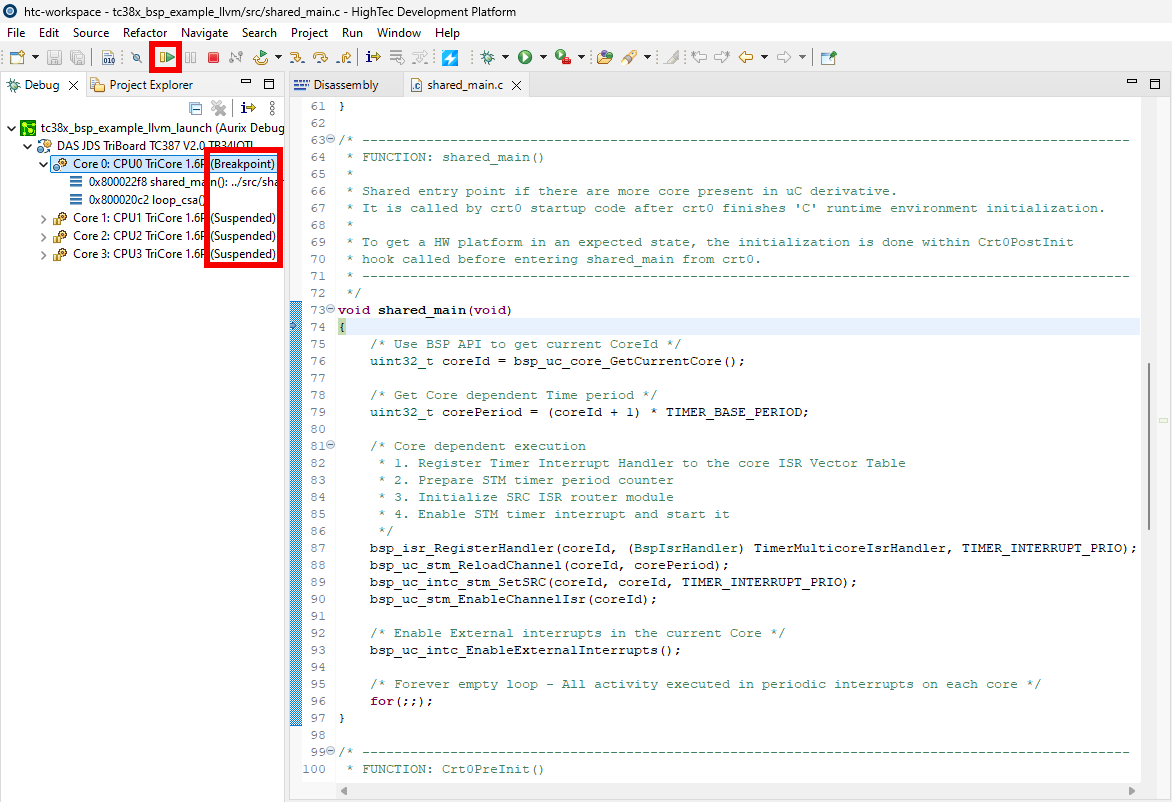
Resume button
Resume will start every core’s execution simultaneously and let them run until a breakpoint is hit, or the user stop the cores with the Suspend button. This button is only active when the cores are in a suspended state.

If the debugger hit a breakpoint, or the user previously pressed the Suspend button, the cores are in the suspended state, the Resume button can be used to start the cores.
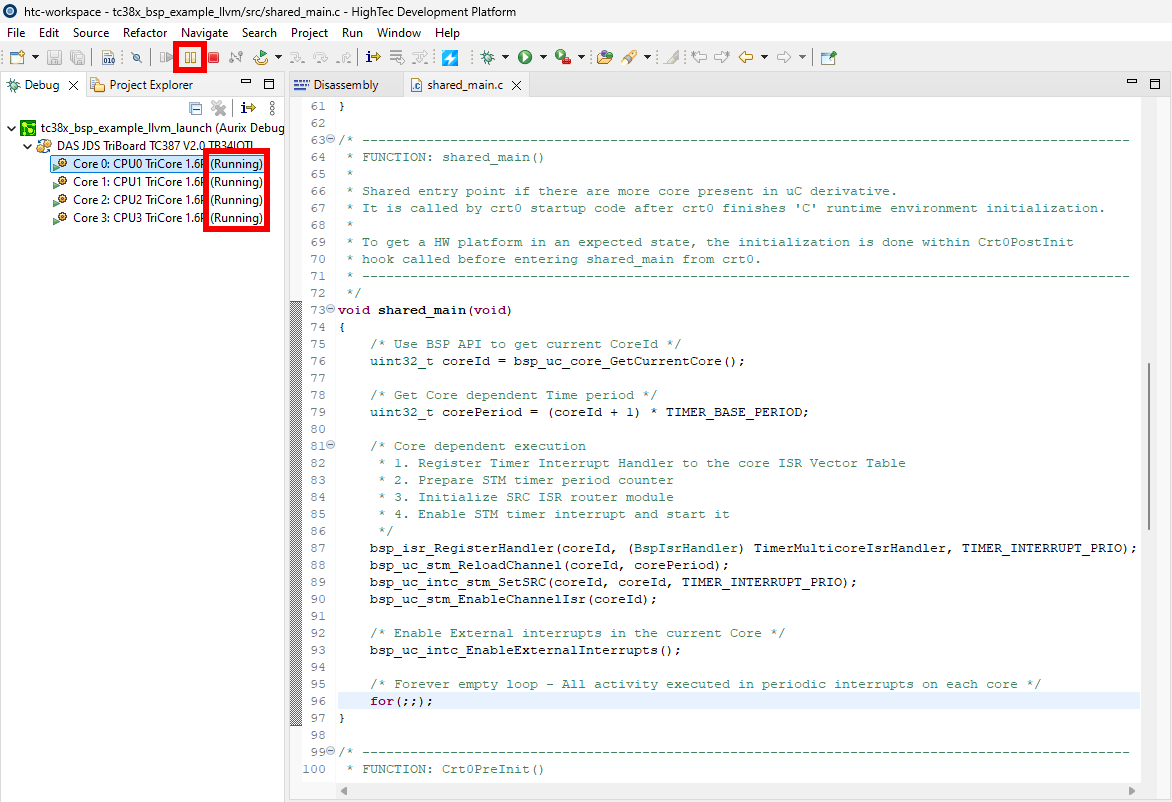
After pressing Resume, the cores will start and run until one of the core hits a breakpoint, or the user presses the Suspend button.

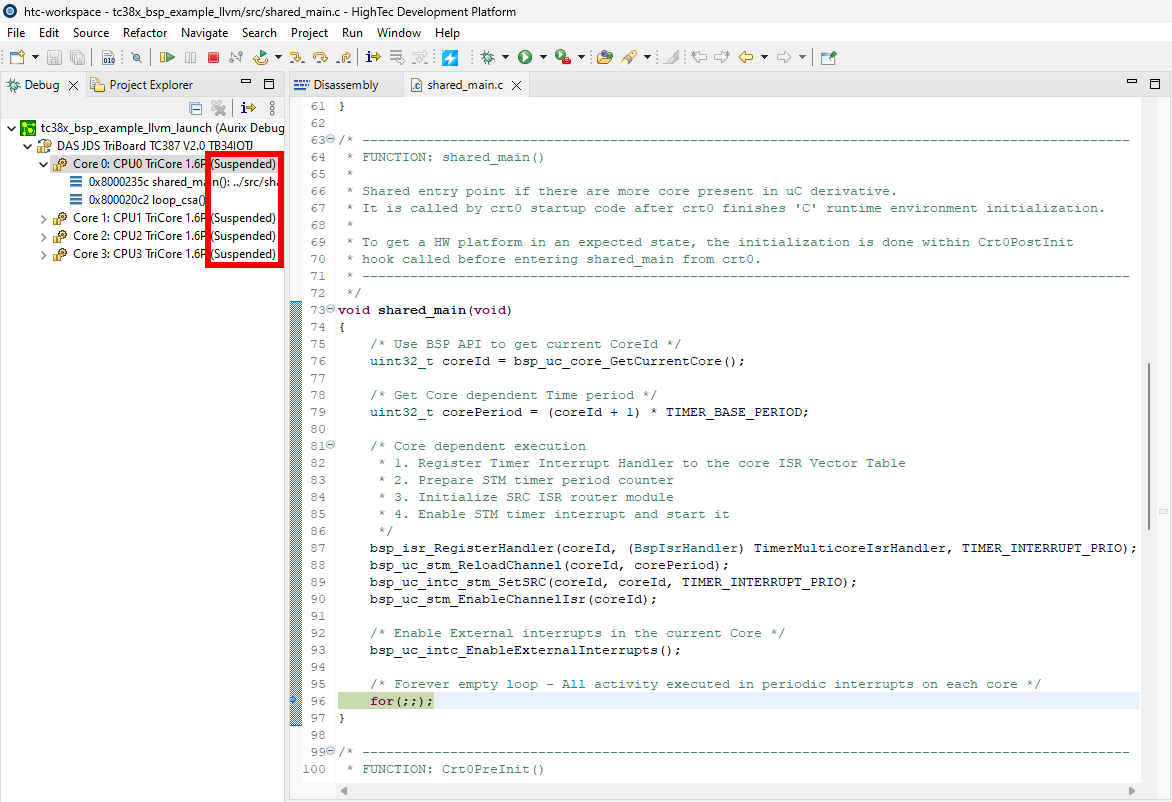
Suspend button
Suspend will stop every cores execution.

This button can only be used when the cores are in the running state.
After pressing Suspend, the cores will stop at the instruction where the execution was interrupted by pressing the Suspend button.
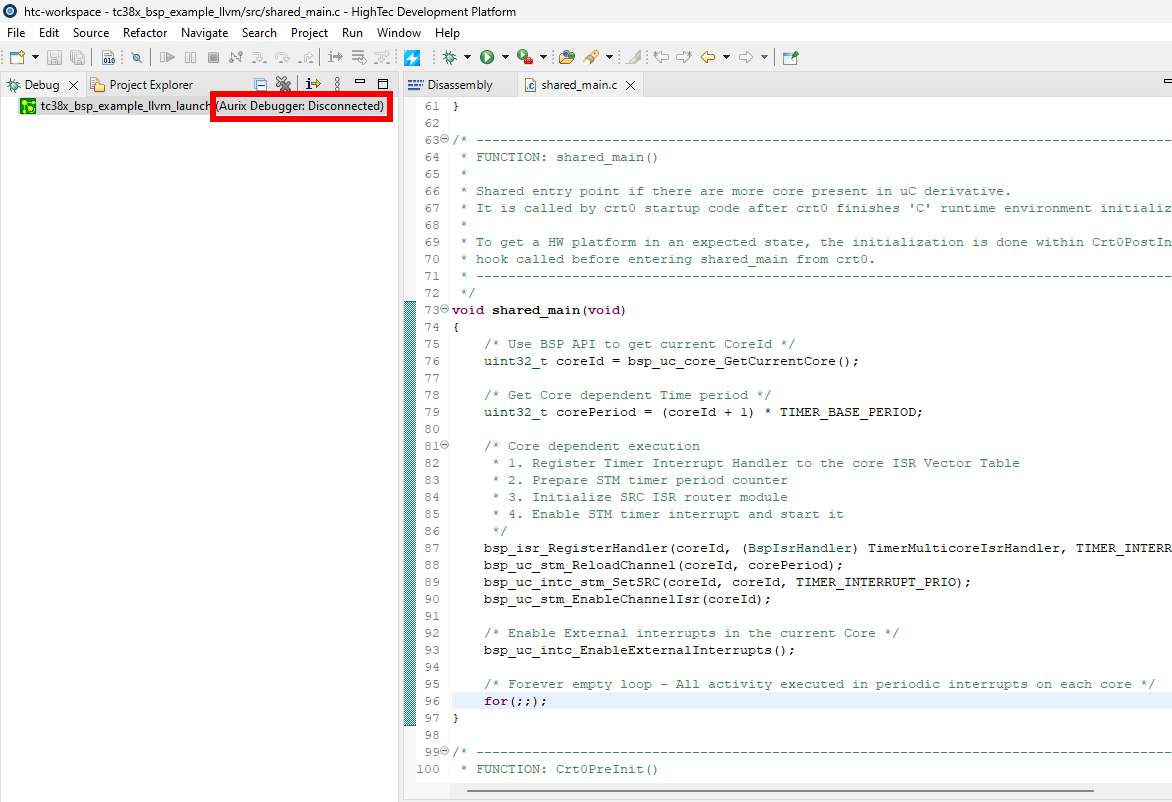
Terminate button
The Terminate button is used to terminate the current debug launch. After termination, the debug configurations must be launched again to start the debugging again.

The Terminate button is always active as long as the debug configuration is running. When pressing the Terminate button, de debugger will disconnect from the board and the debug session is over.
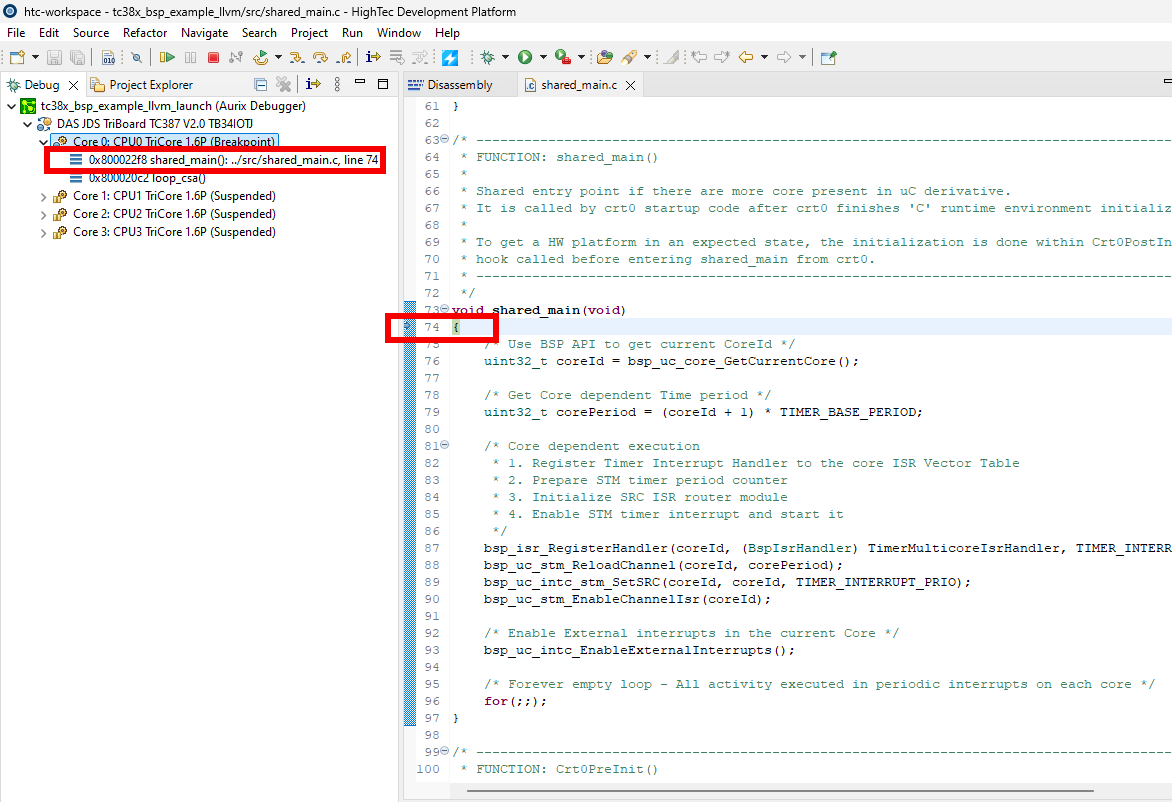
Reset button
The Reset button is used to start the debug session from the beginning, it will reset every core’s execution. After reset, the debugger will go back to the Stop at function, if this is not defined in the debug configuration, then it will stop at the first user breakpoint.

The Reset button is always active during the debug session. When pressed, the debugger will restart the debug session.
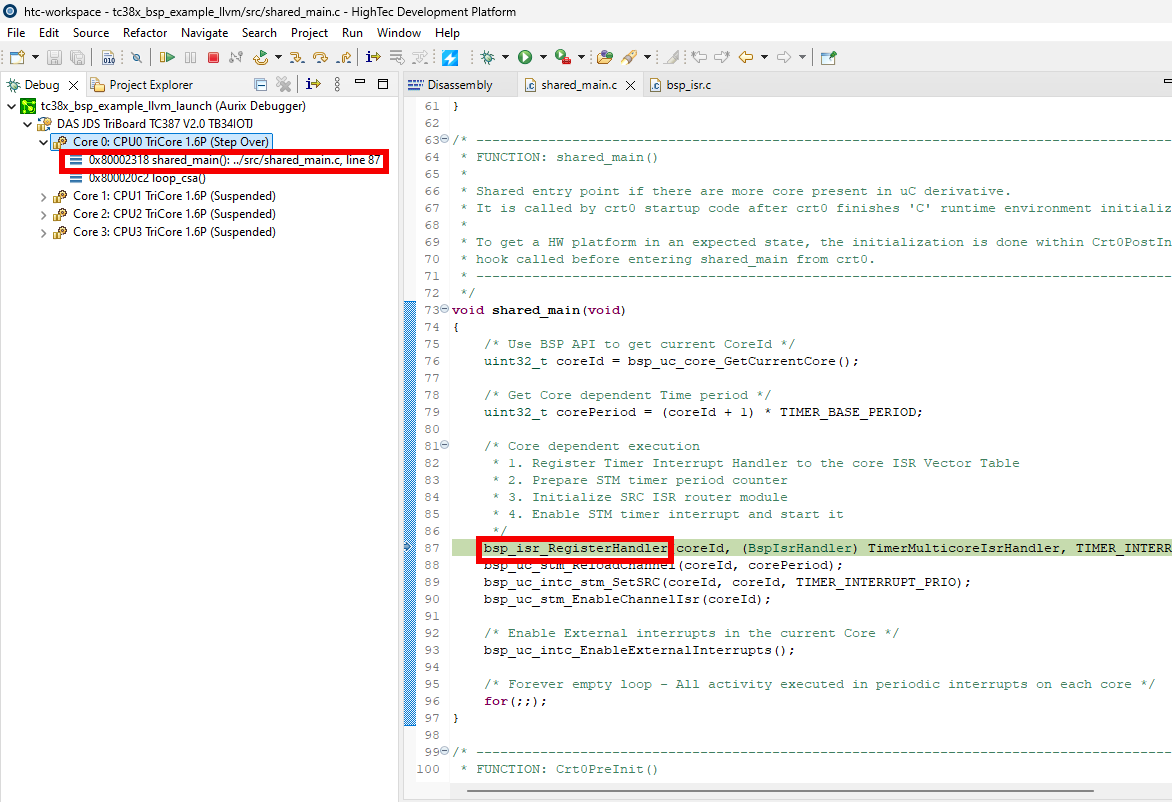
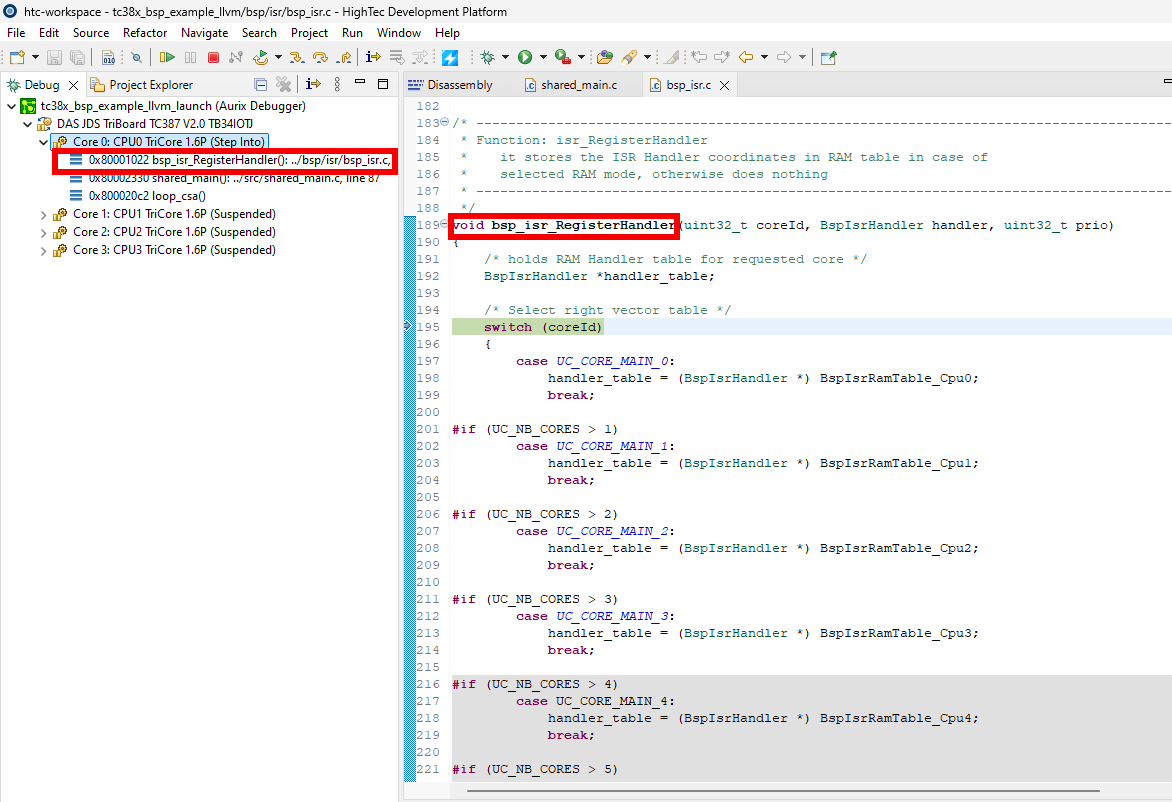
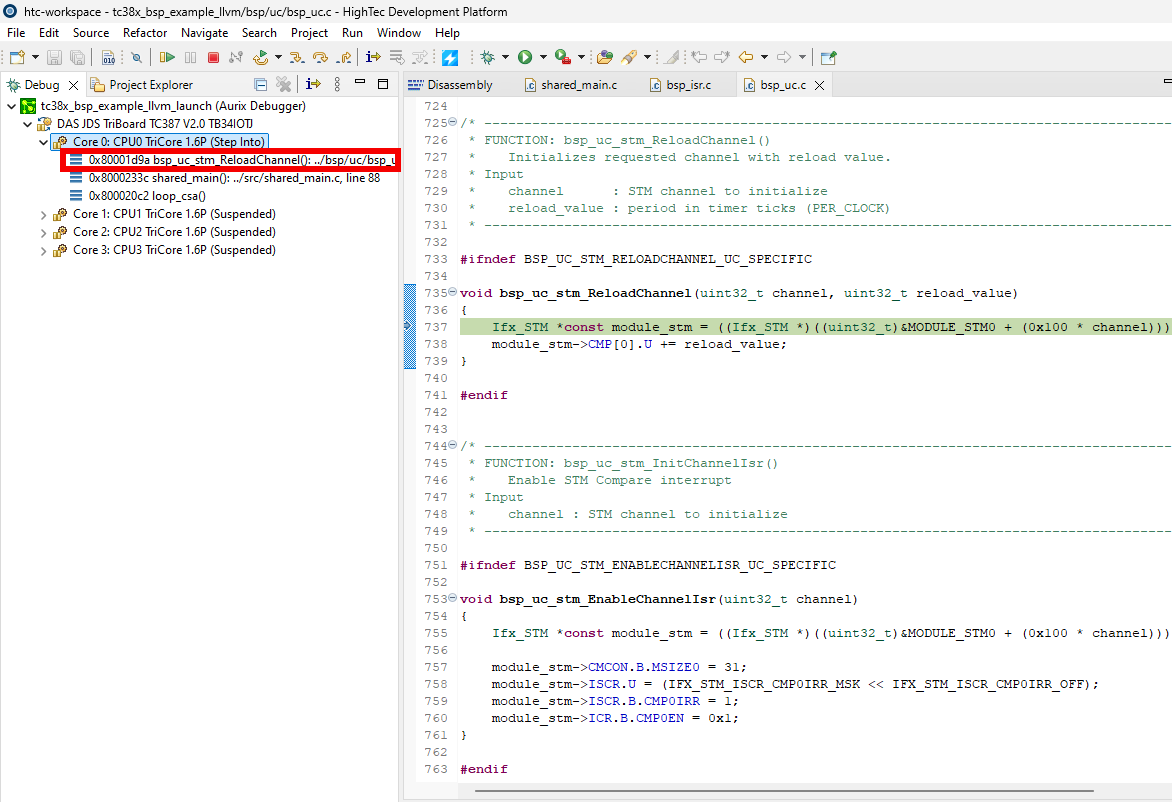
Step Into button
The Step Into button can be used to step inside function calls. It will do regular stepping if the current source line is not a function call. It only performs the step on the currently selected core only.

For function calls, the Step Into button will step inside the function, and the debug view will automatically jump to the functions definition.
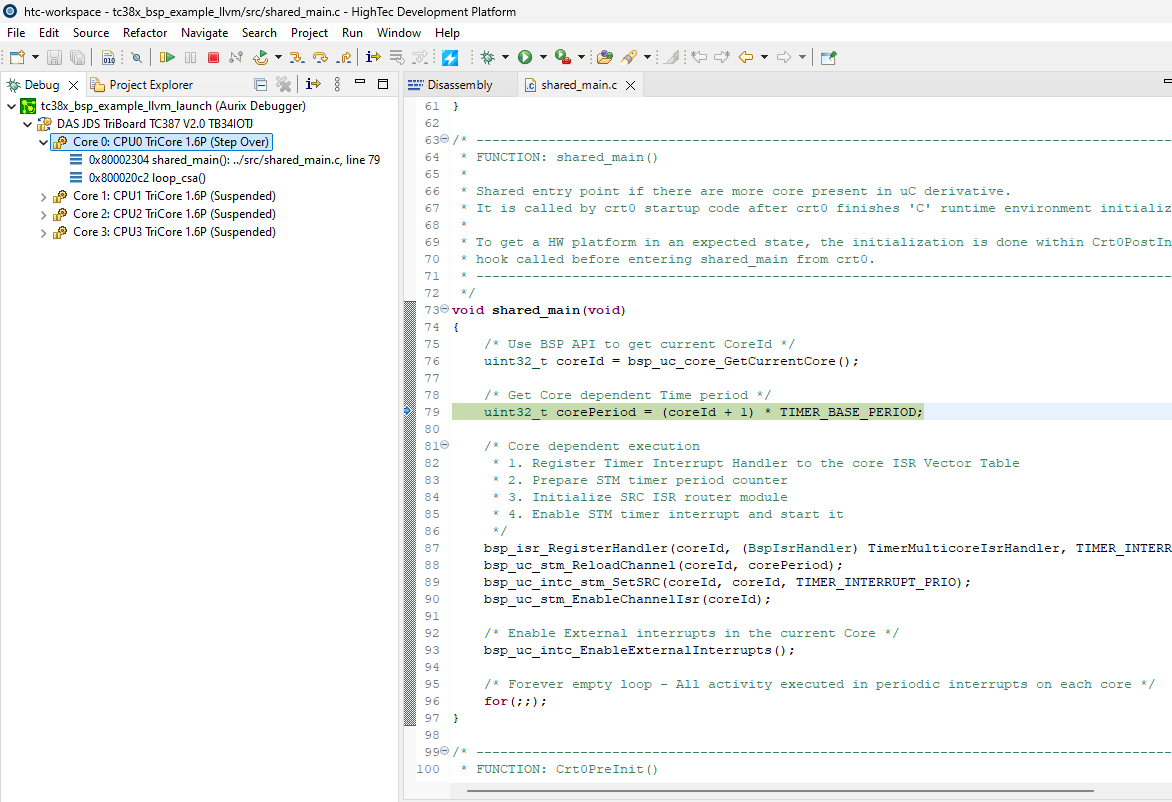
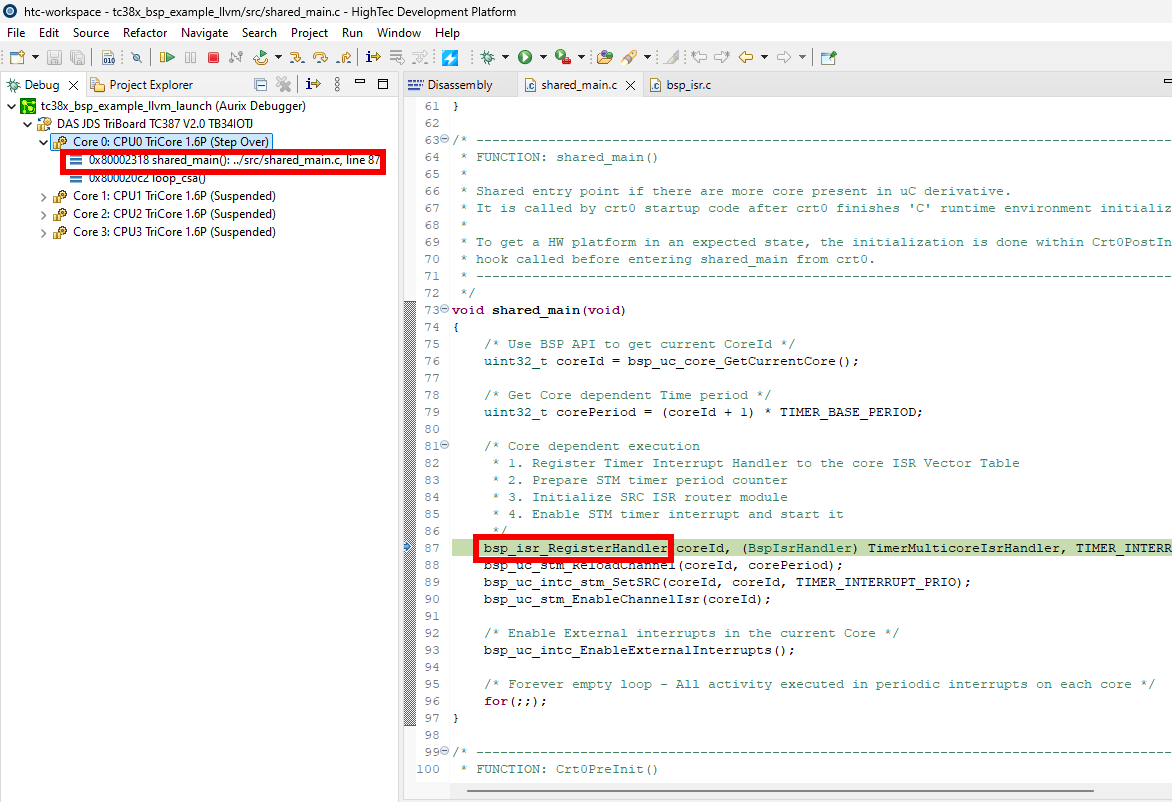
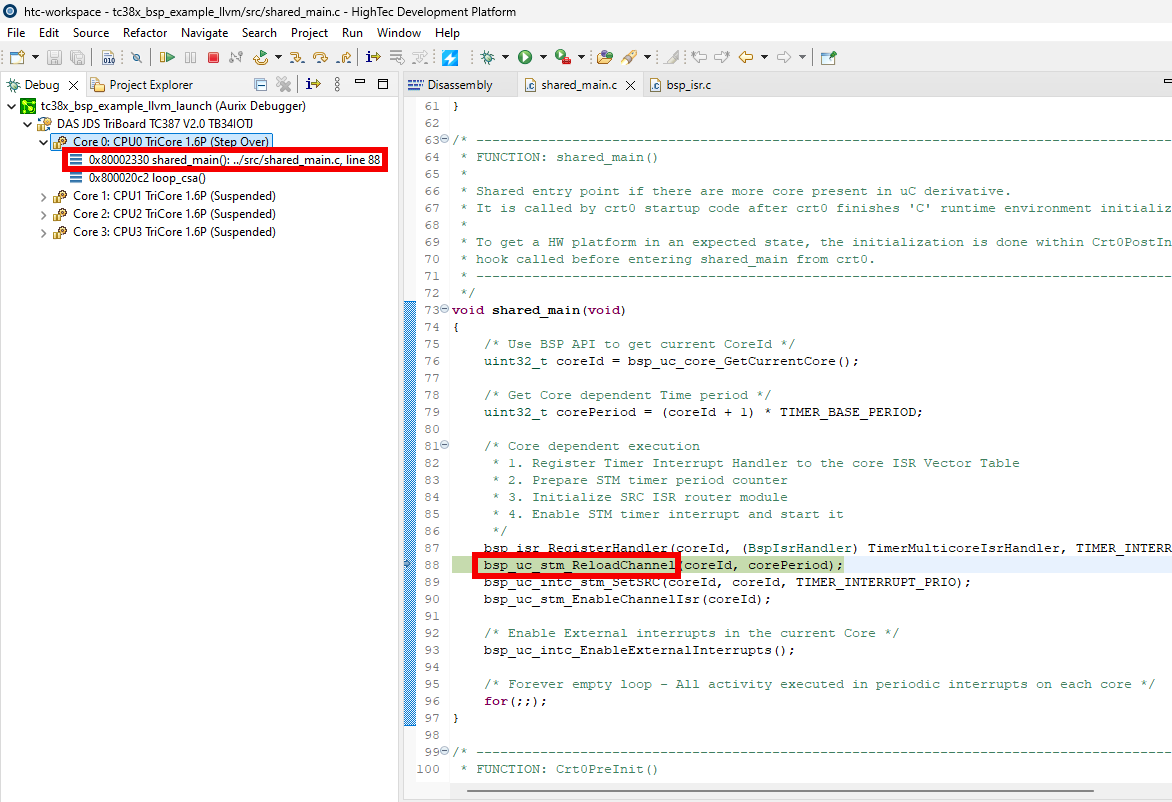
Step Over button
The Step Over button can be used to step over a source line in the source file (so it will jump over function calls). The step over works on the currently selected core only, so it is not synchronized across every core, just the selected core will do the stepping. The Step Over button can also be used to step over inline function calls.

Step Over can be used to step over function calls in the code.
Step Return button
The Step Return button can be used to step out from the current function.

After pressing Step Return the debugger will step out from the currently executed function, and stop at the instruction after the function’s return.

Instruction Stepping Mode button
The debugger is also able to switch between stepping modes. Not only source level stepping is supported, but assembly level stepping as well. This stepping mode can be switched with the Instruction Stepping Mode button.

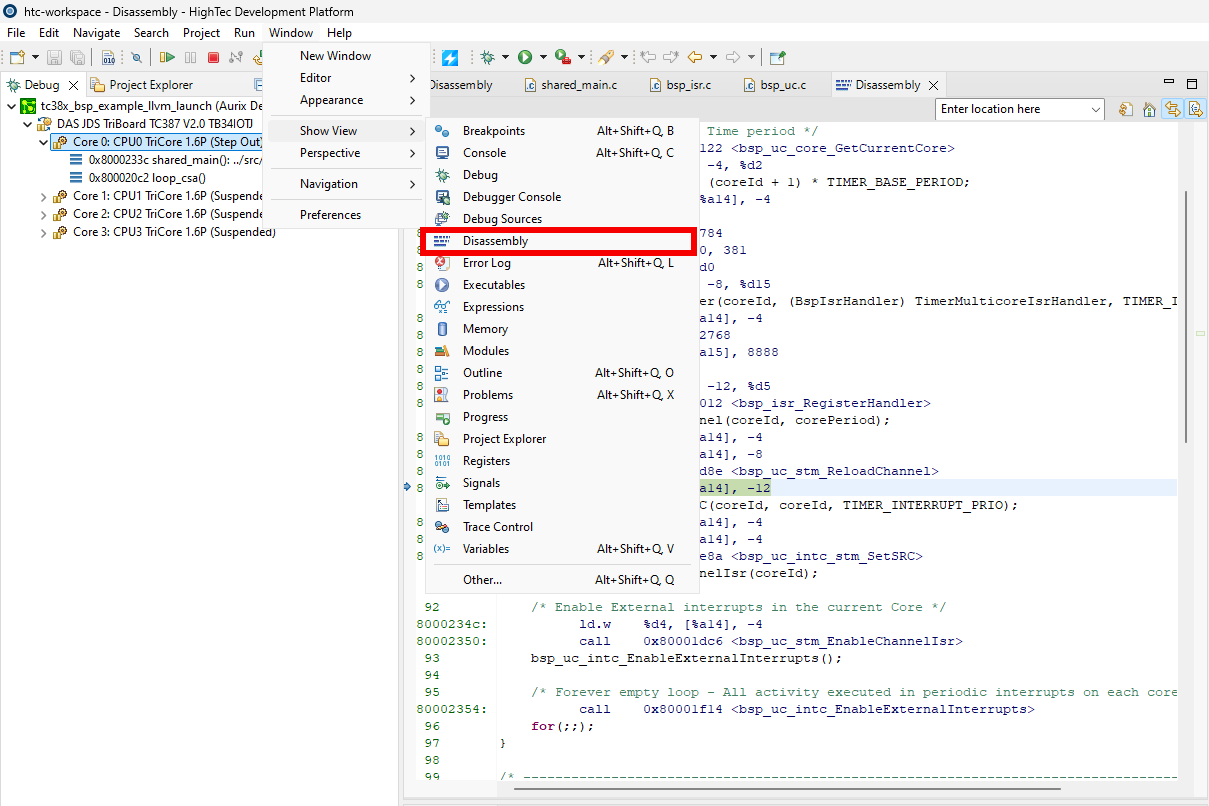
After pressing the Instruction Stepping Mode button, the debugger will show the Disassembly view
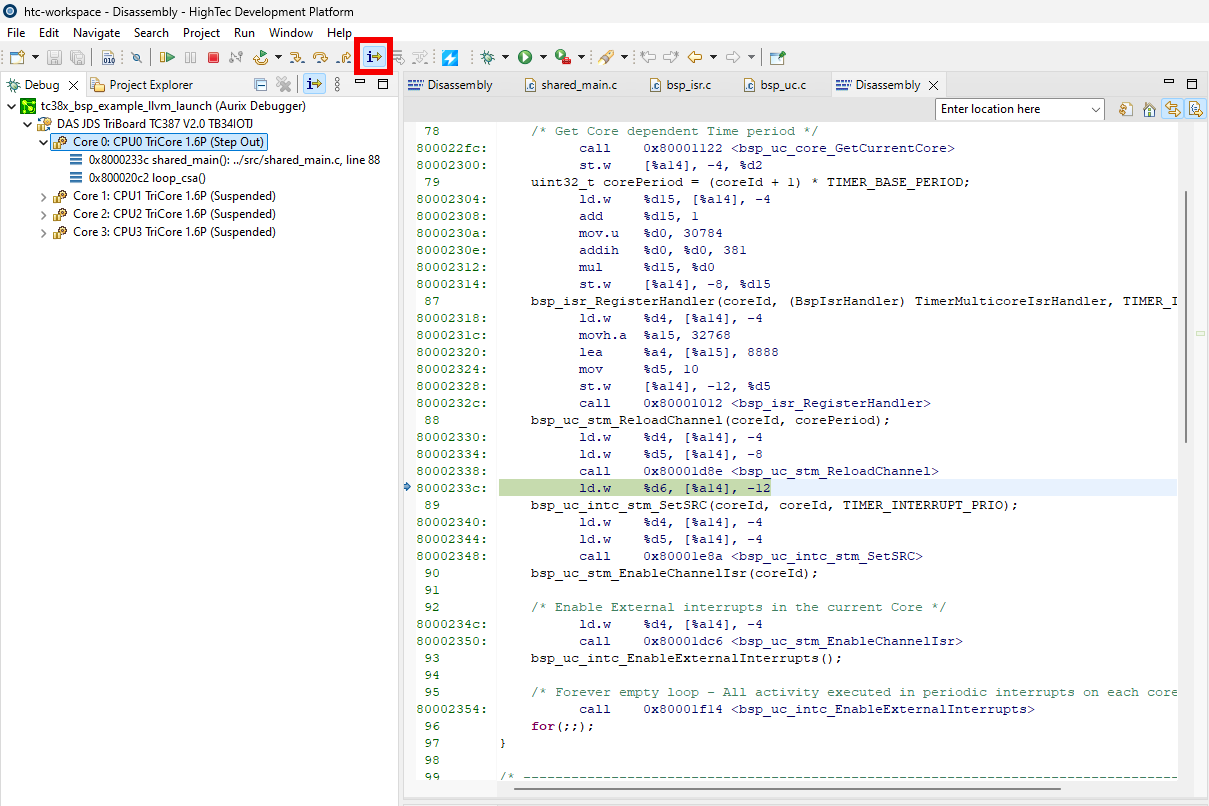
For assembly level stepping, it is useful to open the Disassembly view to see the currently executed binary instruction. To open the Disassembly view go to Window → Show View → Disassembly