Breakpoints
Breakpoints View
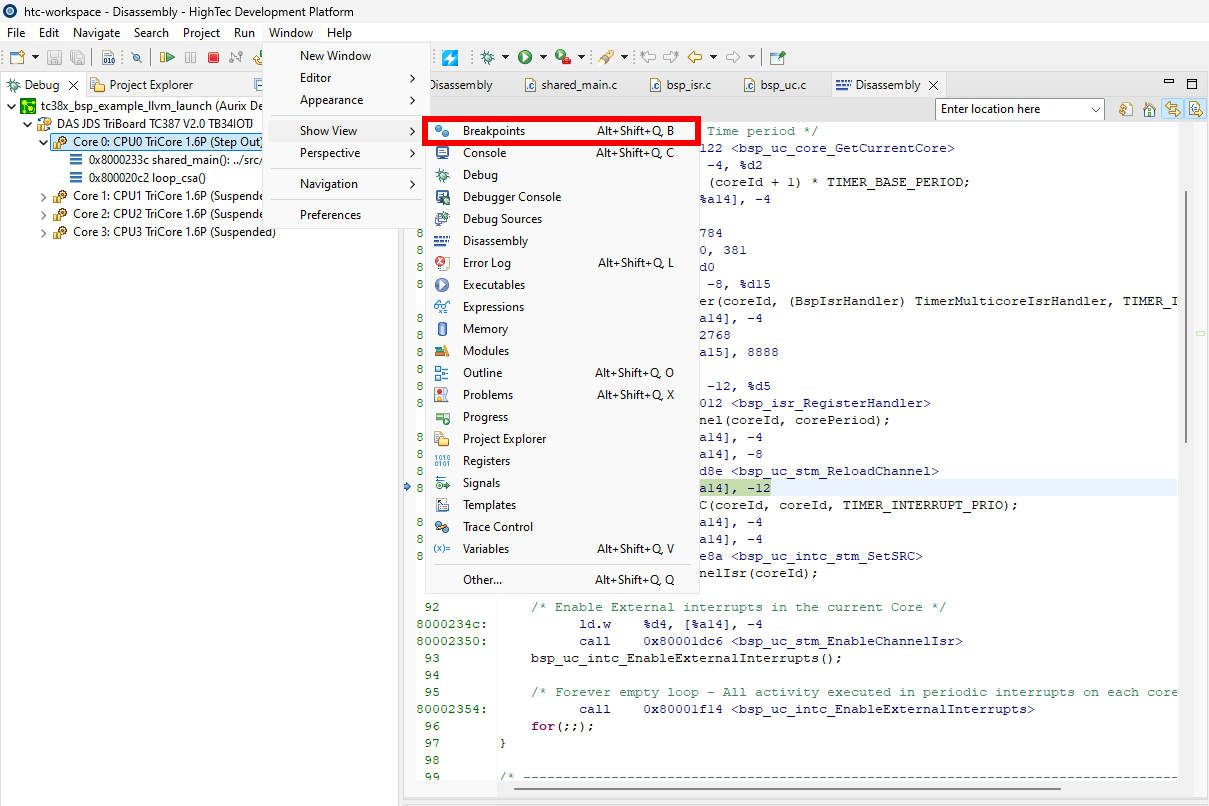
Breakpoints can be placed before, or during the debug session by double left clicking on a given source line in the source file. The breakpoint can be removed the same way as planted. For easier breakpoint management, the Breakpoints View can be used. This view can be opened by clicking on Window → Show View → Breakpoints
In this view, the breakpoints can be toggled ON and OFF by checking/unchecking the box next to them. If a breakpoint is OFF, the debugger will ignore it during debugging.
Manage breakpoints
Breakpoints can be toggled ON and OFF.

Skip All Breakpoints button
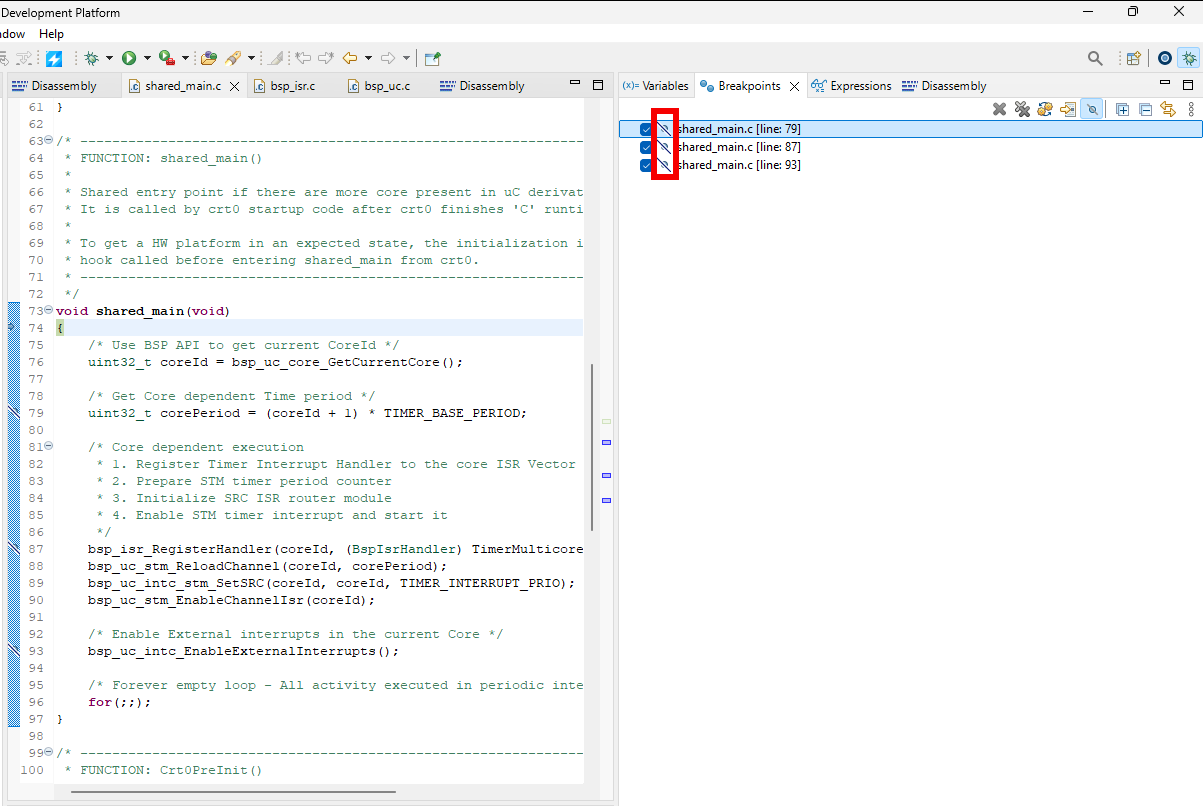
If every breakpoint should be ignored, the Skip All Breakpoints button can be used in the toolbar next to the stepping buttons. This button will make the debugger ignore every existing breakpoint, the only way to activate them again is to press the Skip All Breakpoints button again.

When pressing the button, in the Breakpoints View it can be seen that the breakpoints got disabled.
Removing breakpoints
Using the Breakpoints View, the breakpoints can be removed, either one-by-one, using the Remove Selected Breakpoints (Delete) button, or all of them using the Remove All Breakpoints button.

After pressing the Remove Selected Breakpoints (Delete) button, the selected breakpoint can no longer be seen in the Breakpoints View
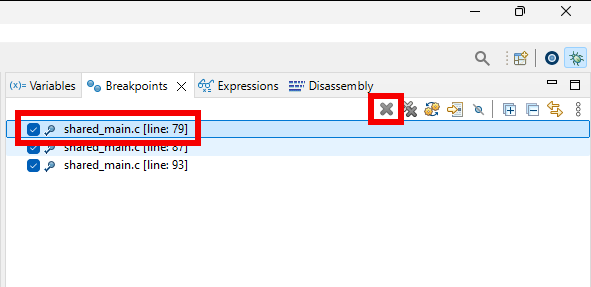
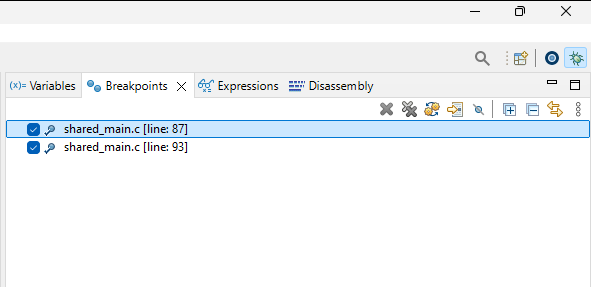
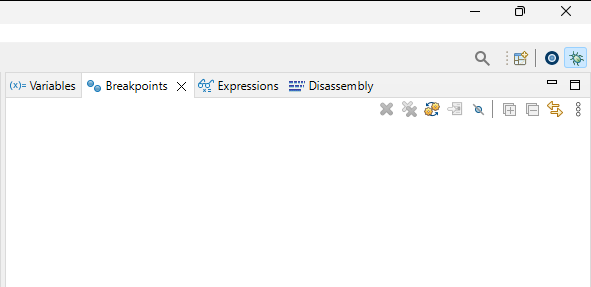
If the user want to remove every breakpoint, the Remove All Breakpoints button can be used.

Deactivate breakpoints for specific Cores
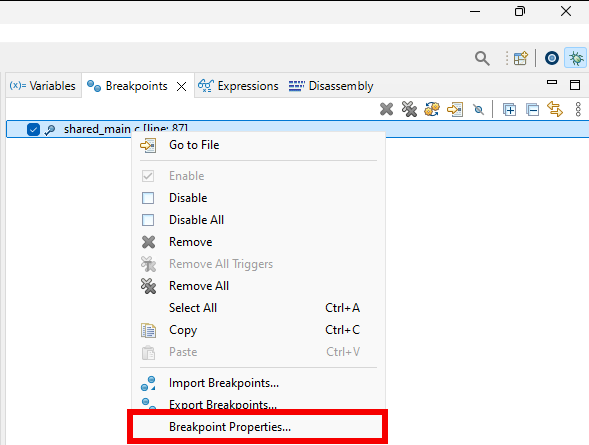
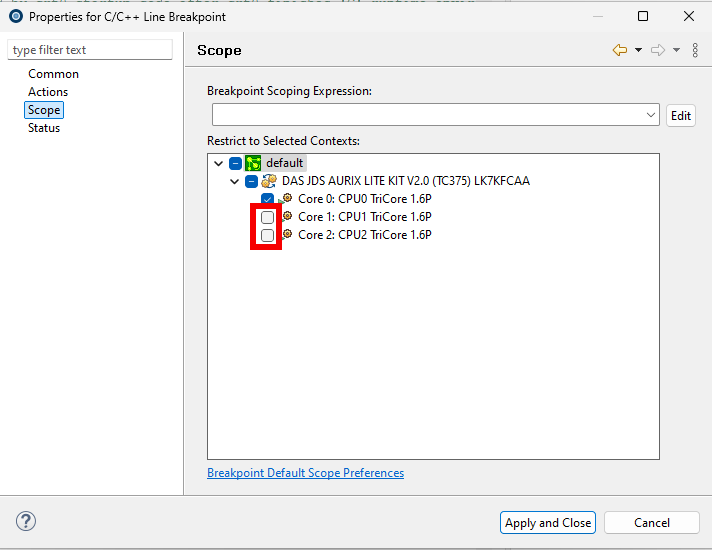
By default, a breakpoint is planted for every Core, if a breakpoint should be ignore for a specific Core, in the Breakpoints View right click on the breakpoint, then go to Breakpoint Properties. In the properties menu select Scope, and simply uncheck the box next to the Core where the breakpoint should be deactivated, then click on the Apply and Close button.
Limitations, inline functions
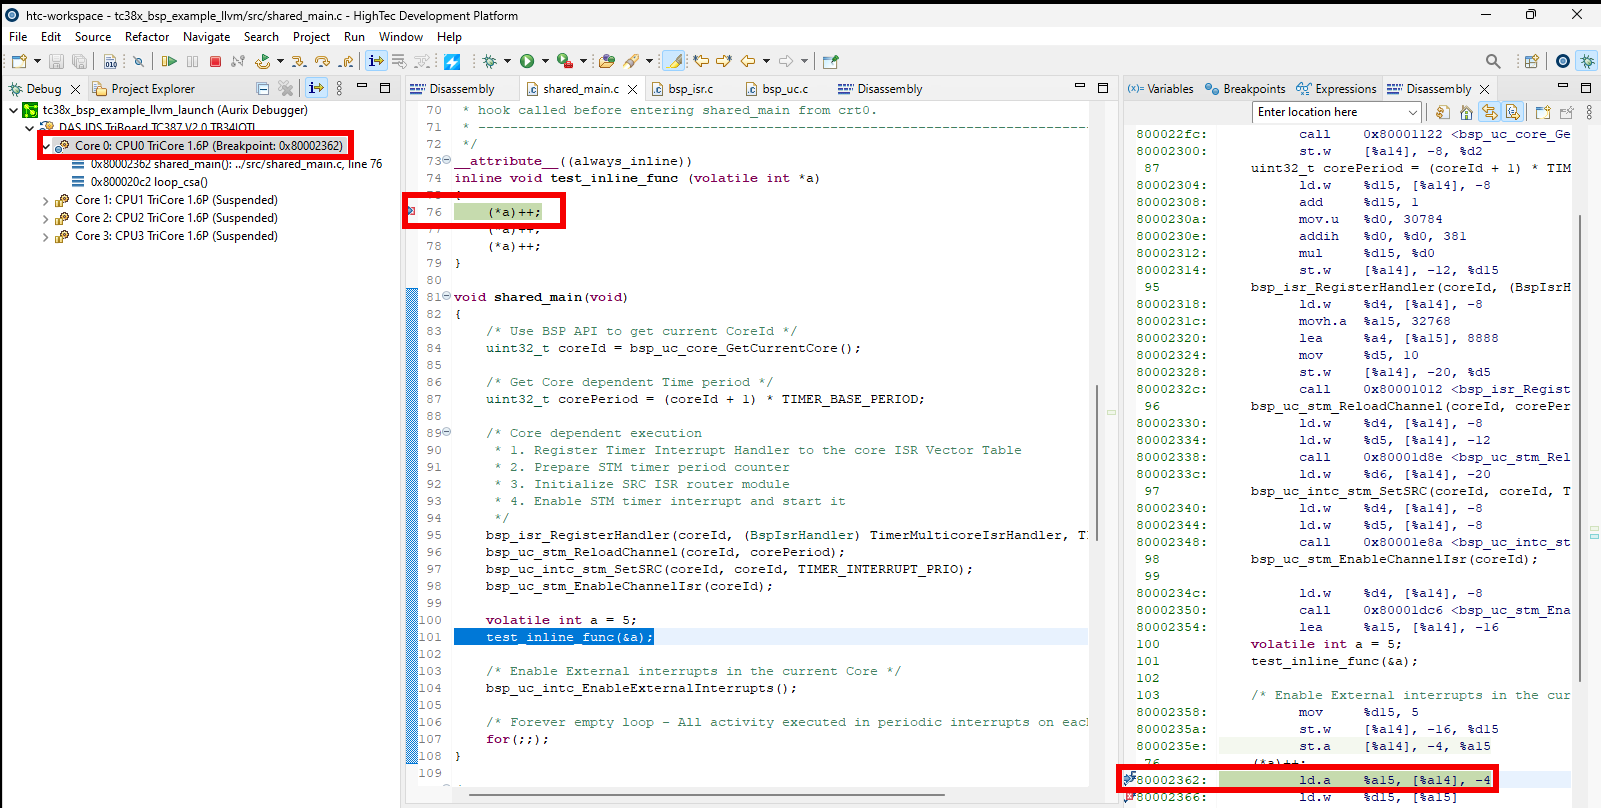
Since TriCore has a limited amount of hardware breakpoints which we can use, planting breakpoints inside inline functions is prohibited, since it would spawn a breakpoint for every call of the inlined function, and we would run out of breakpoints quickly.

However, to be able to debug inline functions, it is allowed to place a breakpoint at the first instruction of the inline function, where it was inline in the code, not in the inlined functions definition. This can be done easily in the Disassembly View.
