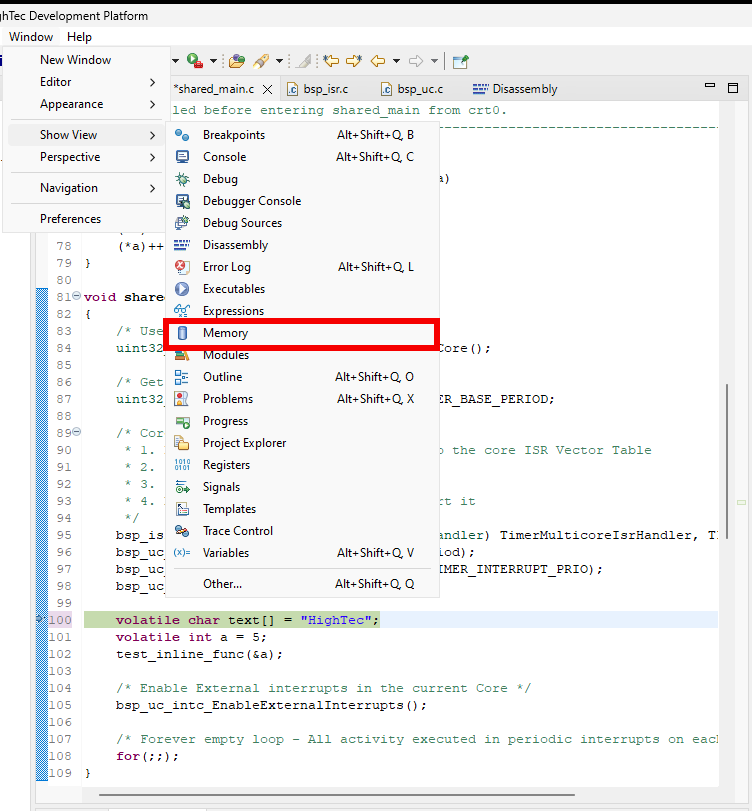
Memory
The Memory View
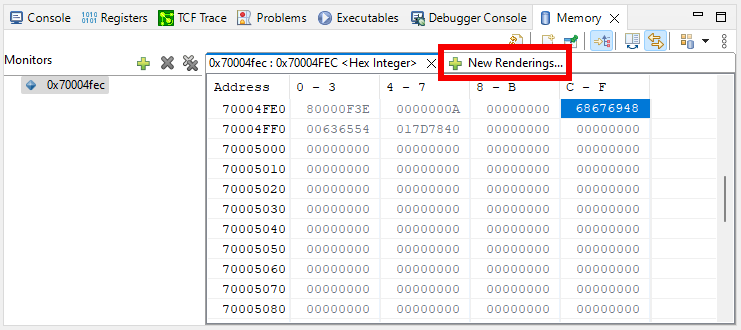
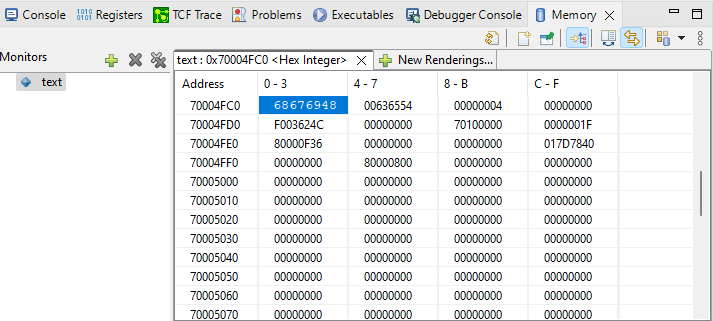
The Memory View can be used to monitor a specific section of the memory of the debugged board. In the left side the Memory Monitors are displayed, which represents a section of memory specified by it’s location called base address. On the right hand side the Memory Rendering pane is displayed where the actual data of the specific memory region is shown.
Memory monitors
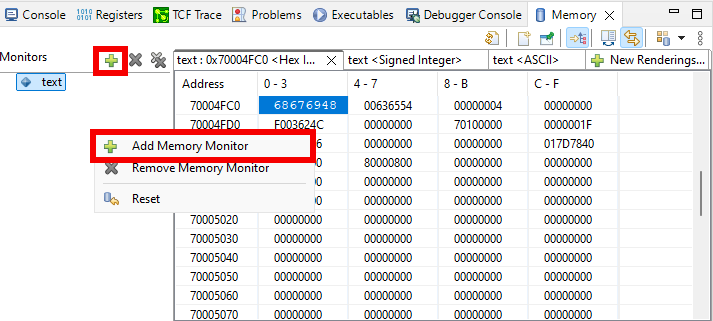
A new memory monitor can be added by the green + icon, or by right clicking in the Memory Monitors pane and click on Add Memory Monitor.
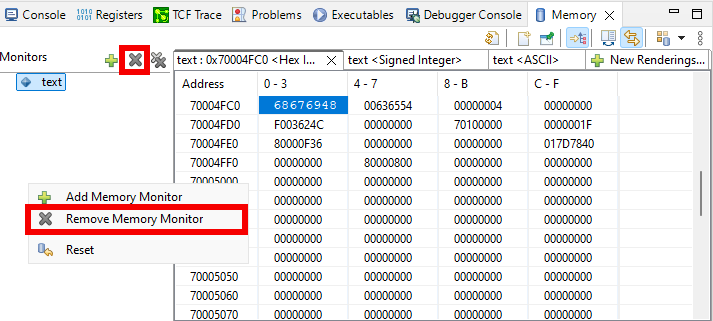
Memory monitors can also be removed by click the X button in the Memory Monitors pane or by selecting a memory monitor the right click → Remove Memory Monitor
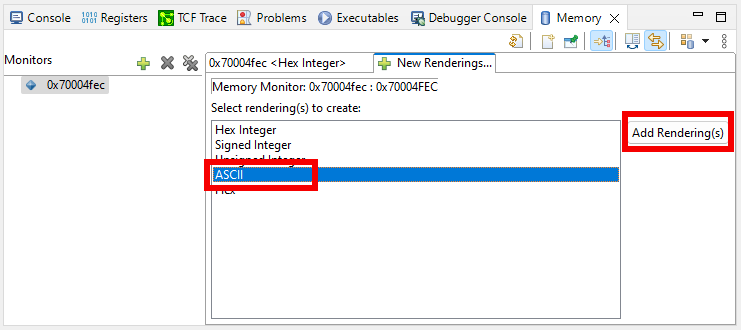
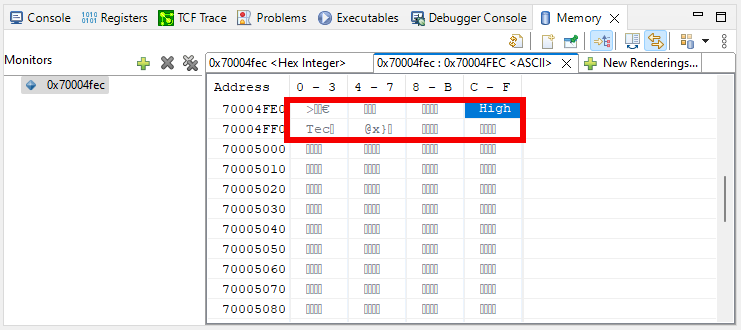
The debugger supports five rendering types — hexadecimal (default), ascii, signed integer and unsigned integer. The default rendering is displayed automatically on the monitor creation. A new rendering can be created at any time by clicking on the New Renderings… button.